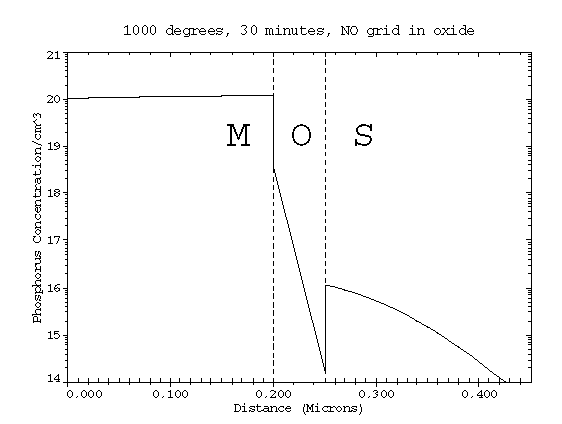
With no grid in the gate oxide, the phos "diffuses" right through.
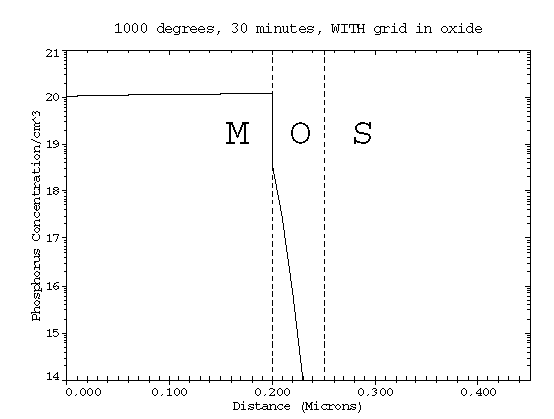
Several grid points in the oxide prevents phos penetration (and Vt shifts).
The following presentation was made August 3rd, 1993 at the annual Stanford TCAD review. Some of the problems indicated here have been corrected since then, but are still included as examples as to the kinds of problems you might encounter in simulation.
Some might argue that this type of negative publicity hurts TCAD. I'll state that my ultimate goal is to improve the quality of simulation. I hope to have success stories elsewhere at this site. Think of this as a counter-balance to all those TCAD publications which show perfect agreement between simulation and measurements.
This presentation highlights the importance of boundary conditions, an aspect of simulation that is typically neglected.
April 17, 1996: update on segregation problem.
April 17, 1996: update on initial point defect concentration.
Limitations/Weaknesses of TCAD Simulators
Michael Duane
SEMATECH
Purpose
Defaults
Examples of Poor Default Coefficients
A pet peeve of mine is that fact that the segregation coefficient
for N-type dopants is constant; independent of dopant species, time, temp,
orientation, or oxidizing ambient.
Polysilicon Default Coefficients
The doubly negative intrinsic diffusivity is multiplied by (n/ni)^2. For high concentrations, this can be quite large. If your poly diffusion model assumes the intrinsic diffusivities for the charged vacancy states are zero, you can get the unusual situation that diffusion in Si is larger than in Poly.
The work-function must be set to get proper Vt results. Wf in
n-type poly is typically 200 mV higher than for Si.
Poor Default Process Models
One of the most common problems in TCAD is the instantaneous de-activation of dopant caused by a final low temperature anneal in the simulation. Dopants don't really deactivate that fast at low temperature.
Some angled implant models simply tilt the incoming beam, and do not
account for the different range due to the tilt angle (no channeling
effects). Other models do properly include the effect of tilt.
Poor Default Device Models
Default coefficients for drift-diffusion impact ionization
typically overpredict the substrate current by factors of 10 or
more. I have not had much success using Energy Balance models.
Specific Problem Cases
Diffusion Through Gate Oxide
With no grid in the gate oxide, the phos "diffuses" right through.
Several grid points in the oxide prevents phos penetration (and Vt shifts).
Dual Pearson Implants
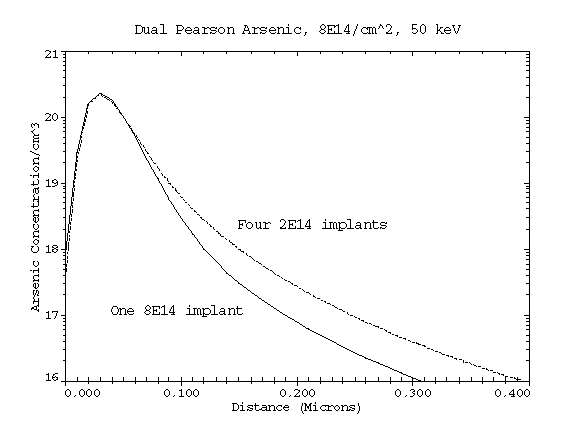
Peter used four 1/4 dose implants in his simulation, just as the
fab did. I simply lumped them together into one implant. There
was a significant difference between the two approaches, as the
channeling tail was dose dependent, but there was no cumulative
damage model. UT promptly corrected this when we pointed it out.
Your version may not have this correction yet.
Boron concentration plots immediately after a 25 keV, 0 degree
tilt, BF2 implant. There may be a sophisticated model for the
channeling tail in the vertical direction, but not for the more
important lateral profile. Of course, it is difficult to measure
the lateral profile. UT is working on this problem using Monte
Carlo simulations.
Capacitance and Boundary Conditions
PISCES forces the potential countours to be perpendicular to the
simulation structure edges. This can induce an artificial constraint
on the problem if your structure is not wide enough.
Capacitance versus Spacing to Reflecting Edges
Spacing  Capacitance  Error
 (um)      (F/um)      (%)
   1      7.64E-17    -38
   2      9.76E-17    -21
   3      1.08E-16    -12.5
   4      1.13E-16    -8.3
   5      1.16E-16    -5.8
   6      1.18E-16    -4.3
   8      1.20E-16    -2.7
  10      1.21E-16    -1.8
  15      1.22E-16    -0.9
  20      1.22E-16    -0.6
This table shows the capacitance of 1 um cylinder that is 1 um
above a ground plane versus the distance to the top, right and left
of the simulation structure. Valery Axelrad pointed out that this
is a worst case, and that you typically don't need structures 10x
wider than the device. But sometimes you do.
Low Temperature N-type Oxidation
Time   Tox    Dose (atoms/cm^2)
(min)  (A)    Oxide    Silicon
 10     78   1.00e09   1.00e13
 20    135   4.92e09   1.00e13
 50    305   9.40e10   1.05e13
100    588   1.07e12   1.12e13
200   1258   1.21e13   2.20e13
500   3191   5.56e13   2.07e13
Notice that the integrated dose is >> than the original implant dose. This problem is not as bad as it used to be. The worst case is slow diffusion and rapid oxidation.
Update: Andy Strachan said he couldn't reproduce this.
Neither could I in recent versions of ATHENA or TSUPREM4. Looks
like this is no longer a problem, although I still recommend
checking integrated doses.
Low Temperature N-type Oxidation
Initial Point Defect Concentration
Junction Depths versus Pre-anneals
 First Anneal   Second Anneal   Junctn Depth
     None             None        .4062
 900 C  1 min   1100 C  1 min     .5070
1100 C  1 min    900 C  1 min     .5313
 900 C 10 min   1100 C 10 min     .5563
1100 C 10 min    900 C 10 min     .4756
This was a disturbing problem. There was a large difference in the results depending on what you assumed for the initial point defect concentration. Typically, you do not specify the initial point defect profile, but they are created and annihilated starting with the first diffusion (even if it is non-oxidizing). When Dave reported this problem, he obtained deeper junctions when the first of the two inert pre-anneals was at the lower temperature. When making an example for this talk, I saw the opposite effect. Turns out the length of the pre-anneals has an effect as well.
Update: Andy Strachan also had trouble reproducing this problem. The pre-anneals appear to have no significant effect in current commercial versions of SUPREM4. However, the junction depth I get now is very different that the values above. This is with the original input file. This points out another issue - the evolution of default models and coefficients. It would be a good idea to keep a few simple examples laying around and re-run them whenever a new release comes out. If the results are different, you can then try to track down the reasons why. For example, the default implant range tables may be different. By placing "print interstitial" statements before and after the implant, I see where the default logical value for including implant damage has changed since the original problem was run. Hence, the same input file gives different results a few years later. It might be a good idea for industry to keep some generic files like this for comparing results when new versions arrive.
I asked Dave Clark for help with this one again. He was able to locate an old version of SUPREM4 which showed similar results to the above. That is, an anneal before the implant affected the final junction depth. This was always an unexpected result. I did not keep track of which version of the program I used to get the above results. In general, it would be a good idea to record the version used. I also received some good support from Don Ward in trying to understand what had changed over the years. More than one thing has changed, and I wasn't able to pin it down to a single cause. Let's just say the old version had a problem that is no longer there.
Again, the current commercial releases do not not show any
dependence on the pre-anneals. However, the junction depth
is now much shallower than the earlier release from the same
vendor, even though DAMAGE is now defaulted to true. The reason
for the shallower junction is unknown. The other major
vendor predicts a junction depth that is even shallower
(significantly). This is due to different implant tables being
used (channeling not included).
Stress Dependent Oxidation
There has been some more work on the coefficients since then.
Look for references by Smeys or Rafferty. Note that stress-dependent
oxidations can be extremely time consuming.
Oxidation Boundary Conditions
A 45 degree step was etched in the silicon from (0.4,0) to (0.6,0.2). This was a quick approximation to what happens in a twin-well process. This was followed by a thick oxidation. The black line shows what happens with the default coefficients - an artificial bulge appears in the center of the structure. With stress dependent oxidation, a more realistic looking structure results (red).
Just a few days before the talk, I created the above overlay for
the first time. That's when I noticed that the red lines are
thicker than the black lines on the left of the structure, but
thinner on the right. There is a 6% difference in the oxide
thickness between the left and right edges with the stress
dependent model. The next figure show why.
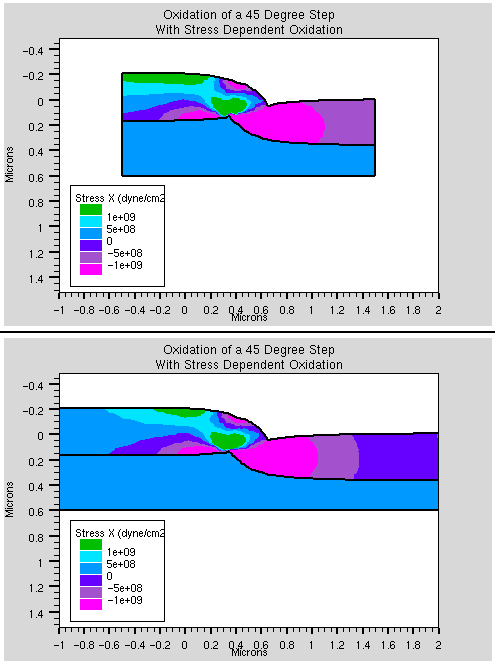
In the original simulation, the structure edge was almost 1.0 um away
from the step in the silicon. This distance was 2.4x the thickness
of the grown oxide, and seemed wide enough. The above
figure shows the x-component of stress for the original structure
and a wider one. The horizontal stress component is still quite high
at the edge of the simulation structure for the narrow (top) case.
Final Remarks
If you haven't tested the sensitivity of your simulation to
the grid, you haven't simulated anything at all!
This page last updated November 10, 1997 by